Uncover hidden genomic variations.


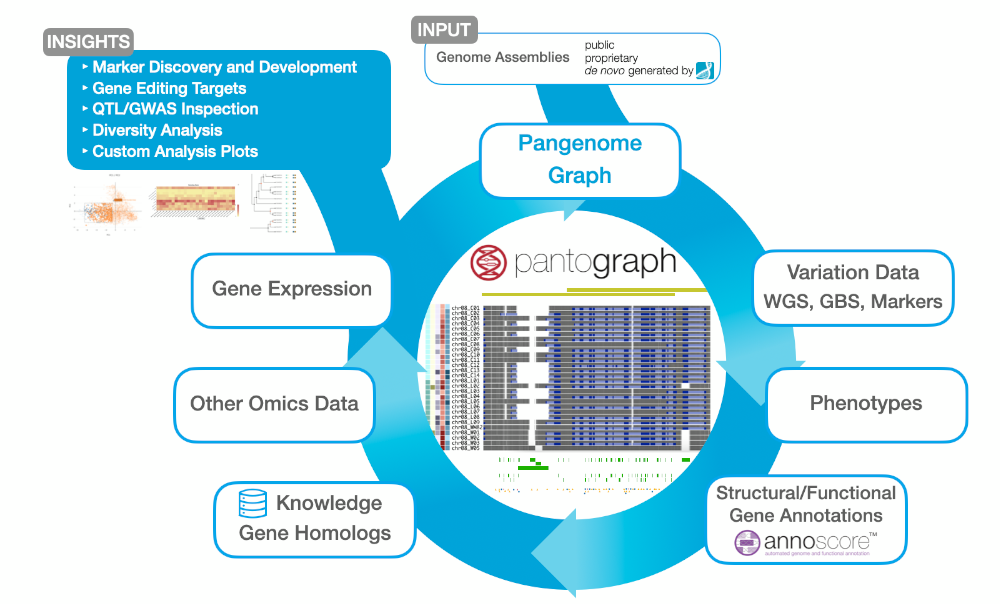
Pantograph, our Pangenome Graph, provides a centralized data hub as well as state-of-the art data browser for all your omics data: genomics, transcriptomics, phenomics and metabolomics. Advance your knowledge about the genetic basis of traits by investigating and interpreting the full spectrum of genomic variation. With Pantograph, you can lift gene discovery, marker development, and gene editing target identification to the next level.
Pantograph provides the most comprehensive representation of pangenomes to date. Including any kind of small- and large-scale variation, the graph paves the way from comprehensive germplasm or microbial genetics characterization to gene discovery, allowing you to Interactively exploring marker-trait associations.
Pantograph revolutionizes how gene editing, genomic research, and breeding companies manage and explore their genomics data.
Benefits:
With Pantograph, intuitively inspect small- and large-scale variation between complete genomes in whole chromosome views, or dive deep to the single nucleotide level (Fig. 2). Compare whole-genome assemblies with all of your other sequencing data in browser tracks. Alongside genetic variation, Pantograph shows any meta data of the tracks such as phenotype information, and allows to sort tracks by meta data or by genetic variants to explore marker-trait associations. Moreover, Pantograph lets you visualize and compare structural gene annotations from multiple genomes in a single view and provides a plethora of information about genes, QTLs, and variants from public or proprietary sources.
Summary:
Our technology is creating quite a buzz in the seeds industry as well as in the food and beverage sector, with several global leading companies already implementing it.
Pantograph works on any species, since it scales to large and complex genomes independent of genome sizes. Computomics can install it on your premises or at a cloud provider, or we host your own instance on Computomics infrastructure. No installation needed. All data will stay with you; on your own storage or in a cloud accessible for Pantograph. Pangenome views can be shared without exchanging data, with your colleagues, clients, or in publications.
Pantograph can be customized to your needs, e.g. integrating other omics data, clustering, PCA, or phylogenetic tree generation and display.
Customer Quotes
“Pantograph helped us gain a much deeper understanding of our material's genomics.”
“Allows different expert profiles within the organization to access all genomic and omics data.”


Our interactive pangenome browser Pantograph offers a comprehensive trait and genomics knowledge base and can incorporate all your omics and phenotypic data to inspect, analyze and correlate in one place and with common and intuitive browser functionalities.